Chart
Charts are one of the more dynamic elements inside UI design that need to be connected and adjusted to real data. All charts that are designed in Figma are simply mockups and it would be pointless to try to derive any data from them. Therefore, we treat charts as mockups in the code generation as well, and simply try to make them as ready as possible to save developers' time.
Each chart template that we output will be a bezier line chart. However, it is very easy to switch the type to a bar chart, pie chart, etc. - these are all imported as part of the package.
We output a data structure template that should be relatively easy to fill in with your dynamic data.
Examples
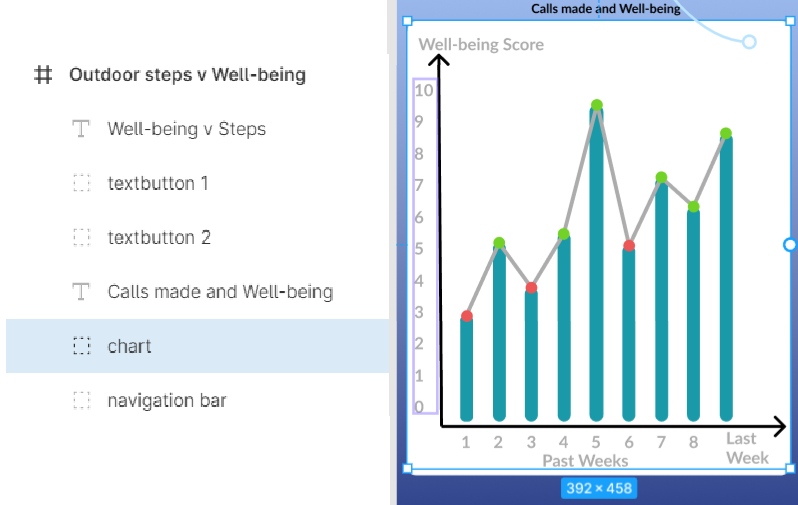
(Left) Grouping of layers (Right) Figma Designed Chart
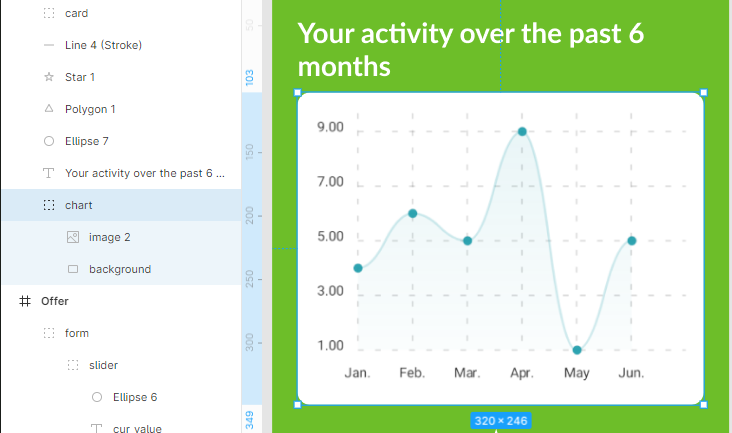
(Left) Grouping of layers (Right) Chart represented by an image
Structure
Our tool currently outputs a chart template in place of any chart that it finds in the wireframes. There is no specific structure requirement apart from the chart being a group.
Styling
Styling of the chart itself (datapoints, lines, legend…) is currently not considered.
You can still style its container and any elements around it (such as its heading).
Naming
- The chart group's name should contain
chart.